


Want more expert insights on the topic of pay equity? Access our entire Pay Equity Deep Dive Series.
As discussed in an earlier blog, a Wage Influencing Factor(WIF) is a factor reflecting skill, effort, responsibility, working conditions, or location applied consistently and fairly in determining employees’ compensation. Essentially, WIFs are compensable factors that one would expect to influence employee pay.
WIFs play an important role in helping to measure pay inequities. Specifically, starting with compensation as our outcome of interest, we add relevant WIFs to a regression model. Once these WIFs are accounted for, we determine if gender, race/ethnicity, and other protected demographic characteristics are statistically related to compensation. If so, we’ll put in place a remediation strategy to address these pay inequities.
The process of deciding which WIFs to include in a pay equity analysis begins with your compensation philosophy. We recommend asking yourself what factors your organization values and rewards, and let the answers guide your decisions. For example, if your organization has a pay-for-performance philosophy, then you’ll want to account for performance in your analysis. Other common factors include career level, company tenure, position tenure, and relevant experience prior to joining the organization.
What Your Company Truly Values and Rewards
The discussion above about which WIFs to include in a pay equity analysis is a theoretical one. It asks an organization to consider what it values and rewards in deciding which WIFs to include. Once those decisions are made and a pay equity analysis is run, the results reveal what an organization truly values and rewards. It’s recommended to assess whether the factors you reward align with your organization’s stated values and pay philosophy.
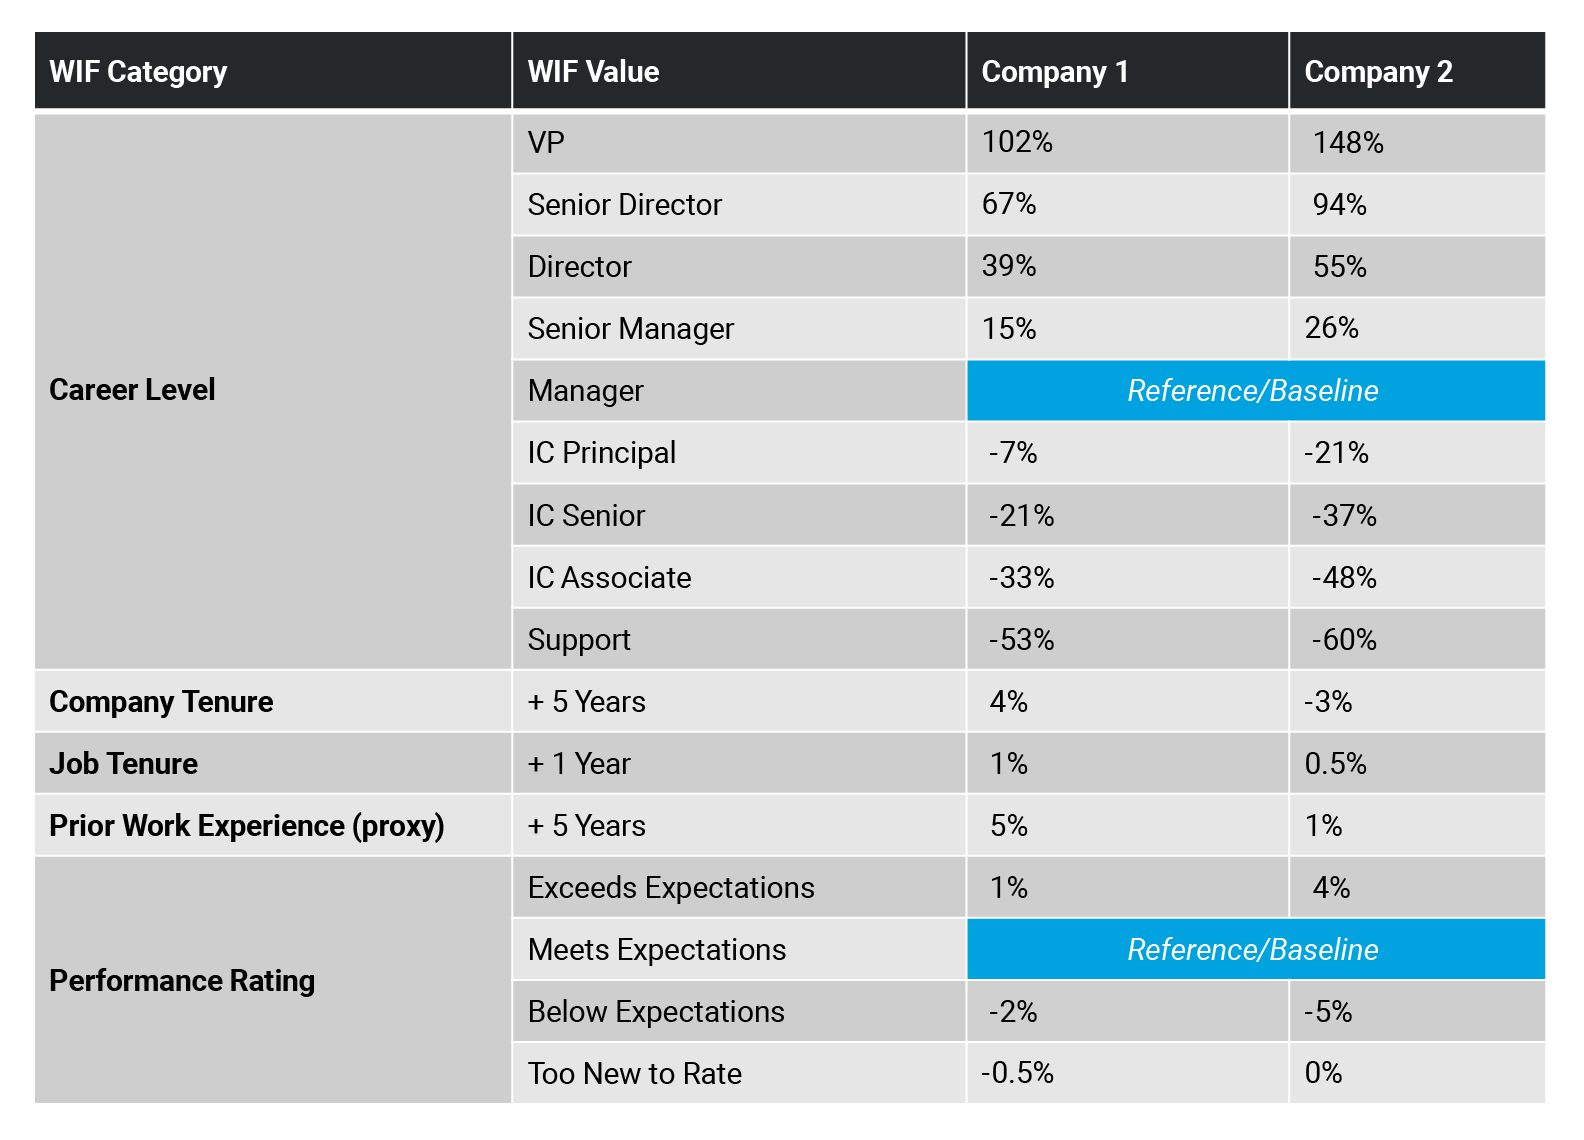
As an illustrative example, the table below shows the drivers of base pay for two different companies. In this illustration, each analysis includes WIFs for career level, company tenure, job tenure, a proxy for prior work experience, and performance ratings. Each model also includes demographic characteristics (e.g., gender, race/ethnicity), although results for these are not shown. Now let’s discuss these results in detail and how they reveal what these organizations value and reward.
Quick Statistics Lesson
Let’s have a quick statistics lesson before we proceed. The percentage figures in the table above show the drivers of base pay for the two companies. For example, the analysis reveals that, all else being equal, an additional year of job tenure is associated, on average, with an additional 1% base pay in Company 1 and an additional 0.5% base pay in Company 2.
When interpreting regression results, all else being equal means that when we are looking at the relationship between one factor (e.g., a WIF) and an outcome of interest (e.g., pay), we are holding the other factors constant. Moreover, in regression, the relationship between a factor and an outcome of interest represents the average relationship between the two.
So, when we say that in Company 1, all else being equal , an additional year of job tenure is associated, on average , with an additional 1% base pay, this means that if we compare two theoretical employees who are otherwise identical (in terms of career level, performance, company tenure, and prior work experience), we would expect, on average, the employee with one more year of job tenure to be paid 1% more than the other employee.
Throughout the remainder of this blog, the terms “all else being equal” and “on average” have been excluded, with the understanding that they are implied.
Lastly, for simplicity, we haven’t indicated which of these drivers are statistically significant. For our purposes, let’s assume they are all statistically significant (and, thus, unlikely to be due to chance).
Career Levels
Looking at career levels, the driver values show the difference in base pay between each career level and the career level that we’ve designated as the reference or baseline. In this case, we have selected Manager as the reference. When a WIF is categorical (i.e., a qualitative variable that takes on a limited number of values), it’s necessary to designate one of the values as a reference. The remaining values are then compared to the reference. There is no magic behind the selection of the reference. Any of the career levels can be used as the reference without changing the underlying relationship between career level and base pay.
As expected, the analysis shows that in both companies, being in a higher career level is associated with higher base pay. However, there are differences between the two companies. Most notably, the increase in base pay across levels is considerably higher for Company 2. For example, in Company 2, base pay at the VP level is roughly two and half times that of Managers. In Company 1, however, base pay at the VP level is only twice that of Managers. A question that arises is whether these pay drivers reflect each company’s pay philosophy. We’ll have more to say about this a bit later.
Experience
We’re capturing experience using company tenure, job tenure, and prior experience before joining the company. The latter is measured using a proxy, which we’ve defined as age at hire minus 18. The two companies paint very different pictures of how they reward experience.
Company 1 rewards all three types of experience. Specifically, an additional five years of tenure is associated with an additional 4% base pay. Each additional year of job tenure is associated with an additional 1% base pay. Lastly, an additional five years of prior experience is associated with an additional 5% base pay.
To provide an example of the value of experience at Company 1, let’s compare two managers, each with a “meets expectations” performance rating. Manager 1 has been with the company for ten years, in their job for three years, and had eight years of experience before joining the company. Manager 2 has been with the company for five years, in their job for two years, and had three years of experience before joining the company. In this example, Manager 1 would be expected to be paid 10% more on base than Manager 2.
Company 2, on the other hand, rewards experience quite differently. In fact, there is a negative relationship between tenure and base pay, such that longer tenure is associated with lower base pay (i.e., negative “returns to tenure”). Particularly, an additional five years of tenure is associated with 3% lower base pay. Each additional year of job tenure is associated with an additional 0.5% base pay and an additional five years of prior experience is associated with an additional 1% base pay. Comparing the two managers as we did in the earlier example, in Company 2, Manager 1 would be expected to be paid 1.5% less on base than Manager 2.
Performance
Lastly, let’s review the performance rating results. Here we’ve used “Meets Expectations” as the reference. In both companies, those with a rating of Exceeds Expectations are paid more on base than those with a Meets Expectations rating, while those with a Below Expectations rating are paid less. That said, the magnitudes of the effects are different. The base pay premium for exceeding expectations is a relatively modest 1% in Company 1, while it is a considerably larger 4% in Company 2. We see a similar pattern for being below expectations, where the base pay penalty is -2% in Company 1 and -5% in Company 2. Based on these results, Company 2 appears to differentiate base pay based on performance more so than Company 1.
Note that we are only looking at base pay. An analysis of variable pay might show greater differentiation based on performance at one or both companies.
Bringing It All Together
Looking at these results collectively, what do they tell us about how these two companies reward their employees, at least in terms of base pay? Rewards in Company 2 come predominantly from promotion (via base pay increases as employees move into higher career levels) and performance, while experience is less valued. Rewards in Company 1 come from a combination of promotion and different types of experience (both company experience and past experience), with less emphasis on performance.
The next question to ask is whether these findings align with each company’s stated pay philosophy. For example, does Company 1 tout its pay-for-performance philosophy? Does Company 2 tout the value it places on experience? If so, these messages may ring hollow to employees who are likely to know what’s rewarded (since they are the recipients of these rewards). On the other hand, both companies can justifiably tout the value of building a career at their respective companies by sharing information on the value of promotion (for example, by sharing pay ranges with employees).
Discovering that your organization’s rewards don’t align with your pay philosophy is an opportunity to rethink how you reward employees (or rethink your pay philosophy!). For example, perhaps the negative returns to tenure at Company 2 are due to pay compression that has caused base pay for longer tenured employees to fall behind that of more recent hires.
One option is for the company to set aside a budget specifically to address pay compression (i.e., adjust the base pay of longer-tenured employees whose pay has fallen behind their less-tenured peers). Furthermore, the company can put in place a process to ensure that pay compression issues don’t arise in the future. One method would be to require the review of incumbent base pay when new employees are hired and, as needed, adjust the base pay of incumbents.
If Company 2 is not willing to make these changes, then it can adapt its pay philosophy to make it clear that the path to higher pay is performance and career advancement and deemphasize the importance of experience.
******
Although the primary purpose of a pay equity analysis is to identify and remediate pay inequities based on protected demographic characteristics, the results of a pay equity analysis also reveal what an organization values and rewards. We recommend setting aside time to consider whether the factors you reward align with your stated values and pay philosophy. If they don’t, create a plan to address the misalignments, either by changing what you reward or by changing your pay philosophy.
